Case Study — Safety by Design: Security Analytics Initiative
Portfolio case study · Application security & data analytics
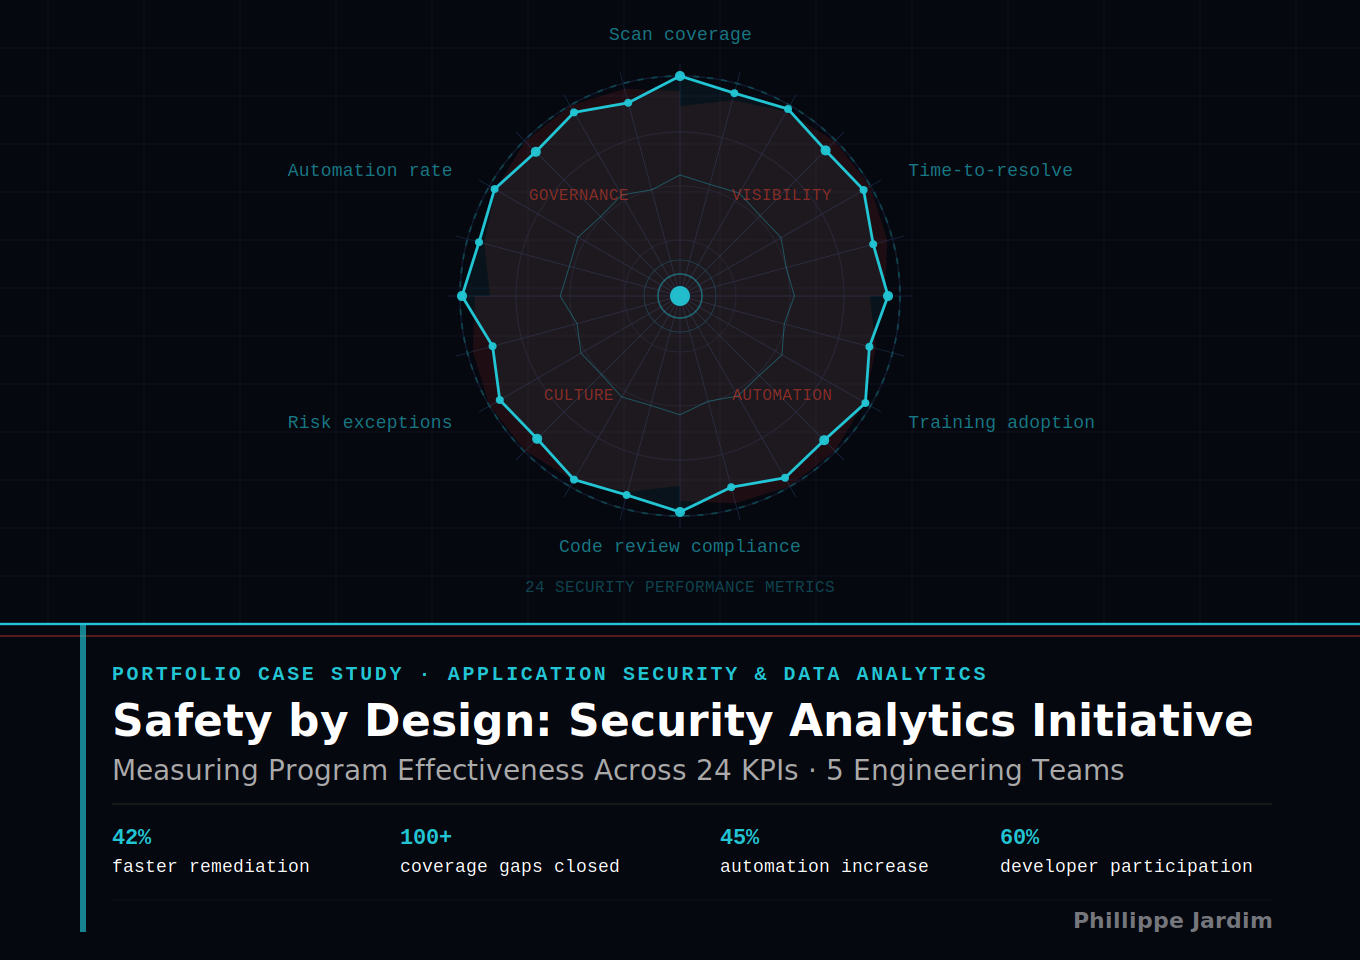
Safety by Design: Measuring What Security Actually Delivers — and Using That Data to Make It Better
How I built a 24-metric analytics program that turned a security initiative into a measurable, continuously improving capability — cutting remediation time by 42%, closing 100+ coverage gaps, and driving a 60% increase in developer participation.
Project manager & data analystApplication securityDevSecOps analyticsDashboard developmentCross-functional leadership
42%Faster high-risk vulnerability remediation
100+Security coverage gaps closed
45%Increase in automated code review coverage
60%Growth in developer secure coding participation
Project context
A security program without a measurement system
Our organization had built a Safety by Design program with a clear intent: embed privacy and security principles into every phase of the product engineering lifecycle, from concept through deployment. The program existed. Engineers were aware of it. But no one could answer the question that actually mattered to leadership: is it working?
At the same time, development teams were expanding rapidly. Security automation processes that had been adequate at smaller scale were struggling to keep pace. Without measurement, the organization had no way to identify where automation was failing, which teams were falling behind, or where the next vulnerability would emerge. Security was being managed on instinct rather than data.
Business challenge
Three unanswered questions with real business consequences
Leadership needed answers that the organization had no infrastructure to provide. The absence of measurable data wasn't just an operational gap — it was a governance risk.
No formal method to measure the Safety by Design program's effectiveness across engineering teams
Security automation processes not scaling with rapid team expansion, creating invisible coverage gaps
No visibility into whether engineers were consistently following secure coding practices
Manual security audits consuming disproportionate time with no data to prioritize effort
Policy decisions made without performance data, limiting the organization's ability to improve
Risk of growing security blind spots in pre-production environments without detection
The core problem was not a lack of security intent — it was the absence of a feedback loop. Without measurement, the program could not improve. Without improvement, trust in the program — internal and external — would erode.
Objectives
What the initiative had to accomplish
1
Evaluate the Safety by Design program with real dataDefine and implement measurable KPIs that reflect actual secure development practices — not self-reported compliance.
2
Build and deploy a live security analytics dashboardDeliver real-time visibility across 24 security performance metrics, accessible to both engineering teams and executive stakeholders.
3
Identify and close automation coverage gapsSurface the blind spots in pre-production security scanning and prioritize remediation by business risk.
4
Drive measurable improvements in developer security behaviorUse data to target training interventions, reduce friction in secure coding workflows, and increase developer engagement with security tooling.
5
Deliver under significant constraintsExecute the full initiative with teams operating at full capacity and a limited budget — requiring rigorous prioritization and dual-role delivery as both PM and data analyst.
My role
Project manager and data analyst — simultaneously
This initiative required me to operate in two distinct professional modes at once. As Project Manager, I defined scope, aligned stakeholders across application security, engineering, and compliance, managed delivery against resource and budget constraints, and translated technical findings into executive-level decisions. As Data Analyst, I led the design and implementation of the analytics framework, defining the 24 KPIs, engineering the dashboard architecture, and performing the trend analysis that surfaced actionable insights.
The dual role was strategical. Having the same person own both the analysis and the program management eliminated the translation loss that typically occurs between data teams and delivery teams. I could move directly from insight to recommendation to execution without a handoff.
Approach & key decisions
Measurement before intervention
1
Stakeholder alignment and KPI definitionBefore selecting a single metric, I collaborated with application security leads, engineering managers, and compliance teams to define what "effective" actually meant for this program. KPIs were tied to DevSecOps maturity and privacy-by-default principles — not generic security benchmarks. This grounding ensured the metrics would drive decisions, not just fill a dashboard.
2
24-metric dashboard architectureWorking with data engineers, I defined 24 security performance data points covering scan frequency and coverage, time to resolve security issues, secure coding training adoption, pull request security review compliance, and risk acceptance trends. The dashboards were designed for two audiences simultaneously: engineering teams needing operational detail, and executives needing governance-level visibility — a distinction that required deliberate information architecture decisions, not just data presentation.
3
Passive data collection integrated into existing workflowsI integrated analytics into the CI/CD pipeline and internal developer tools to collect data without adding friction to developer workflows. The principle was clear: measurement should not become a burden on the teams being measured. Passive collection also eliminated self-reporting bias — the data reflected what teams actually did, not what they reported doing.
4
Trend analysis and cross-team benchmarkingI performed structured trend analysis and benchmarking across product teams to identify automation blind spots, underperforming service areas, and opportunities for early security intervention before deployment. Findings were presented to the cross-functional security commission — translating data patterns into prioritized, actionable recommendations rather than raw analysis.
5
Targeted automation and policy refinementWorking with security automation engineers, I used the analysis to improve scanning rules and reduce false alarms — which had been eroding developer confidence in the tools. I also recommended updated alert thresholds, clearer ownership models, and targeted training programs built around each team's specific gaps.
Challenges & mitigations
Delivering measurable results under real constraints
This project did not have the luxury of a dedicated team or an unconstrained budget. Every decision was made in the context of limited resources and teams already operating at capacity. That context shaped the entire delivery approach.
ChallengeMitigation
No existing measurement infrastructure — the program had never been instrumented, so there was no baseline to build from.
Invested in stakeholder alignment first to define what "success" meant before selecting any metric — preventing the common failure of measuring what is easy to track rather than what actually drives project outcomes
Engineering teams operating at full capacity — additional data collection or tooling friction risked active resistance or disengagement.
Designed passive CI/CD-integrated data collection that required no developer action, ensuring measurement did not compete with delivery velocity.
Multiple stakeholder audiences with different data needs — executives, engineering managers, and developers each required different views of the same data.
Engineered tiered dashboard views purpose-built for each audience, with the same underlying data presented at appropriate levels of abstraction for each context.
High false-positive rates in existing security scanning tools were eroding developer trust and causing alerts to be ignored.
Used analysis findings to directly refine scanning rule sets in partnership with security automation engineers, reducing noise and restoring developer confidence in the tooling.
Limited budget required dual-role delivery — no dedicated analyst resource, meaning PM and analytical work had to be executed by the same person without sacrificing quality in either.
Structured the initiative in sequential phases where PM and analytical responsibilities peaked at different times, preventing role conflict and maintaining delivery integrity throughout.
Results & impact
Security transformed from reactive burden to measurable capability
Security visibility & governance
Live dashboards deployed across 5+ engineering teams and executive security leadership enabling real-time monitoring of security KPIs for the first time in the organization's history.
Data-backed policy decisions replaced manual audit cycles reducing administrative overhead while improving the quality and frequency of security governance decisions.
Performance & automation gains
100+ security coverage gaps identified and closed in pre-production environments, vulnerabilities that had been invisible without the analytics infrastructure.
42% reduction in average time to remediate high-risk vulnerabilities — driven by prioritization based on business impact data rather than arbitrary queue order.
45% increase in automated code review coverage expanding the security perimeter without adding manual review overhead to development workflows.
Culture & program maturity
60% increase in developer participation in secure coding practices measured through training completion rates and tool adoption, not self-reporting.
New internal benchmark established for measuring application security effectiveness in product development, giving the organization a durable standard for future program evaluation.
Lessons learned
You cannot improve what you cannot measure — but measurement itself must be designedThe most consequential early decision was investing in KPI definition before any dashboard was built. Choosing the wrong metrics would have produced a sophisticated-looking system that answered the wrong questions. Measurement design is a strategic act, not a technical one — it requires understanding what decisions the data will inform before determining what data to collect.
Friction is a security risk in itselfSecurity tools that burden developers get ignored. The decision to use passive CI/CD-integrated data collection was not a convenience choice — it was a risk management decision. When developers find security workflows obstructive, they route around them. Reducing friction is not about accommodating convenience; it is about ensuring security controls are actually used.
Constraints force better prioritizationOperating as both PM and analyst with a limited budget and fully-loaded teams produced a tighter, more disciplined initiative than unconstrained resources might have. Every decision had to be justified against business impact. That discipline resulted in a focused set of improvements with measurable outcomes, rather than a sprawling initiative with diffuse results.
Data changes conversations, not just decisionsBefore this initiative, security discussions between engineering and leadership were largely qualitative — assertions without evidence. After the dashboards launched, those conversations became anchored in shared data. The cultural shift — from opinion-based to evidence-based security governance — proved as valuable as any individual metric improvement.
"Security without measurement is policy without accountability. My role was to build the feedback loop that turned intent into evidence — and evidence into continuous improvement. That is the standard I apply to every complex program I lead."